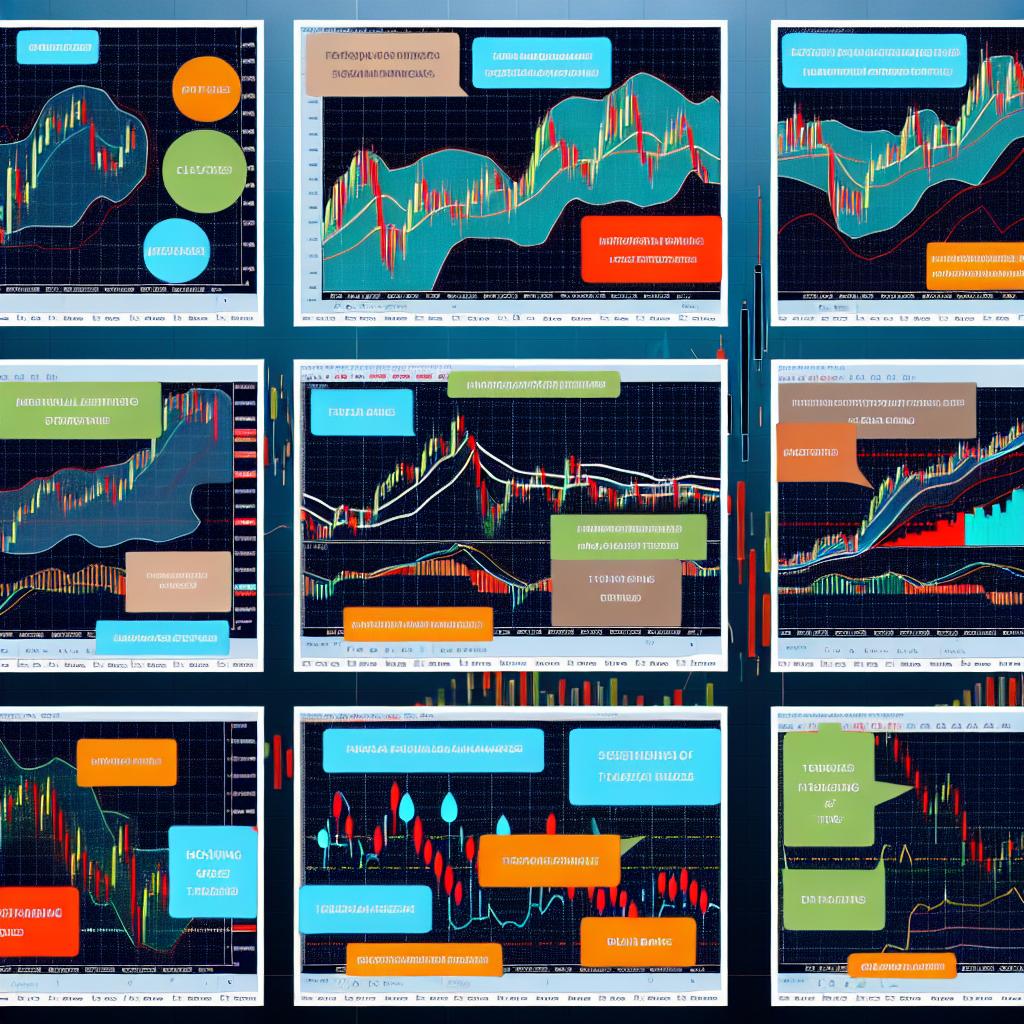
The Significance of Technical Indicators in Forex Trading
In the domain of forex trading, technical analysis is a pivotal component. It involves examining past market data, with a primary focus on price and volume, to anticipate future price movements. Technical indicators act as essential instruments for traders, offering insights that enable them to make informed decisions. This discourse delves into some of the paramount indicators utilized in technical analysis for forex trading.
Moving Averages
Among the myriad tools available to forex traders, the Moving Average (MA) is one of the most ubiquitous. This indicator assists in smoothing out price data by establishing a perpetually updated average price. Its primary utility lies in aiding traders to discern the direction of market trends. There are various forms of moving averages:
Simple Moving Average (SMA): This is computed by averaging the closing prices over a predetermined period. The SMA represents an uncomplicated approach to understand market trends by reducing the ‘noise’ from random price fluctuations.
Exponential Moving Average (EMA): Unlike the SMA, the EMA assigns greater weight to more recent prices, allowing it to respond more swiftly to price changes. This characteristic makes the EMA particularly advantageous for traders seeking to capture short-term market movements.
Both the SMA and EMA are instrumental in identifying support and resistance levels, alongside potential buy or sell signals. These averages can provide a foundation upon which traders can build more complex trading strategies. For those seeking an in-depth understanding of moving averages, further resources are available.
Relative Strength Index (RSI)
The Relative Strength Index (RSI) stands out as a momentum oscillator, designed to measure the velocity and magnitude of price movements. With a scale ranging from 0 to 100, it is often employed to pinpoint overbought or oversold market conditions. When the RSI tends to exceed 70, it typically signals that a currency pair might be overbought; conversely, an RSI below 30 can indicate that it is potentially oversold. This indicator is invaluable for traders aiming to gauge when a market reversal could occur, thereby facilitating strategic entry and exit decisions.
Bollinger Bands
Conceived by John Bollinger, Bollinger Bands constitute a type of price envelope plotted at standard deviation levels above and beneath a simple moving average. The components of Bollinger Bands include:
– A middle line that is essentially a simple moving average.
– An upper line, which is the SMA supplemented by a trading range of standard deviation.
– A lower line, which is the SMA subtracted by a trading range of standard deviation.
The spacing between these bands is contingent upon market volatility, rendering Bollinger Bands a potent tool for detecting breakout points and shifts in market volatility. Their adaptability allows traders to anticipate significant price movements and adjust their strategies accordingly.
MACD (Moving Average Convergence Divergence)
The MACD indicator is a dominant trend-following momentum tool that elucidates the relationship between two moving averages of a security’s price. The MACD consists of two primary elements: the MACD line, representing the difference between two exponential moving averages (typically a 12-day EMA and a 26-day EMA), and a signal line, which is the 9-day EMA of the MACD line. A cross of the MACD line above the signal line could suggest a buy opportunity, while a cross below might indicate a sell opportunity.
Understanding the Role of Technical Indicators
While these indicators supply invaluable insights into market trends and probable future trajectories, it is imperative to employ them alongside other forms of analysis and market investigation. Sole reliance on indicators can offer an incomplete perspective on market conditions. For constructing all-encompassing trading strategies, traders should take into account additional factors, such as market news, economic indicators, and global events. There are resources available for those interested in learning about the integration of technical analysis with other methodologies.
In conclusion, the judicious application of technical indicators can amplify a forex trader’s capacity to assess market conditions and execute more informed trading decisions. Comprehending and employing these indicators correctly is a cornerstone of successful forex trading. Utilizing these tools within a broader analytical framework aids traders in navigating the complex landscape of forex markets, ultimately fostering informed and strategic decision-making, thereby enhancing their trading outcomes.
This article was last updated on: June 9, 2025