Understanding Forex Market Reversals
In the intricate world of forex trading, the ability to recognize market reversals—a scenario where the direction of a price trend changes, either from bullish to bearish or vice versa—holds significant importance. Not only does this skill help traders in making informed trading decisions, but it also contributes substantially to their overall trading performance and profitability. The utility of technical indicators, like the Relative Strength Index (RSI) and the Moving Average Convergence Divergence (MACD), is paramount in this regard. By effectively leveraging these indicators, traders can refine their strategies and potentially increase their prospects for success in the forex market.
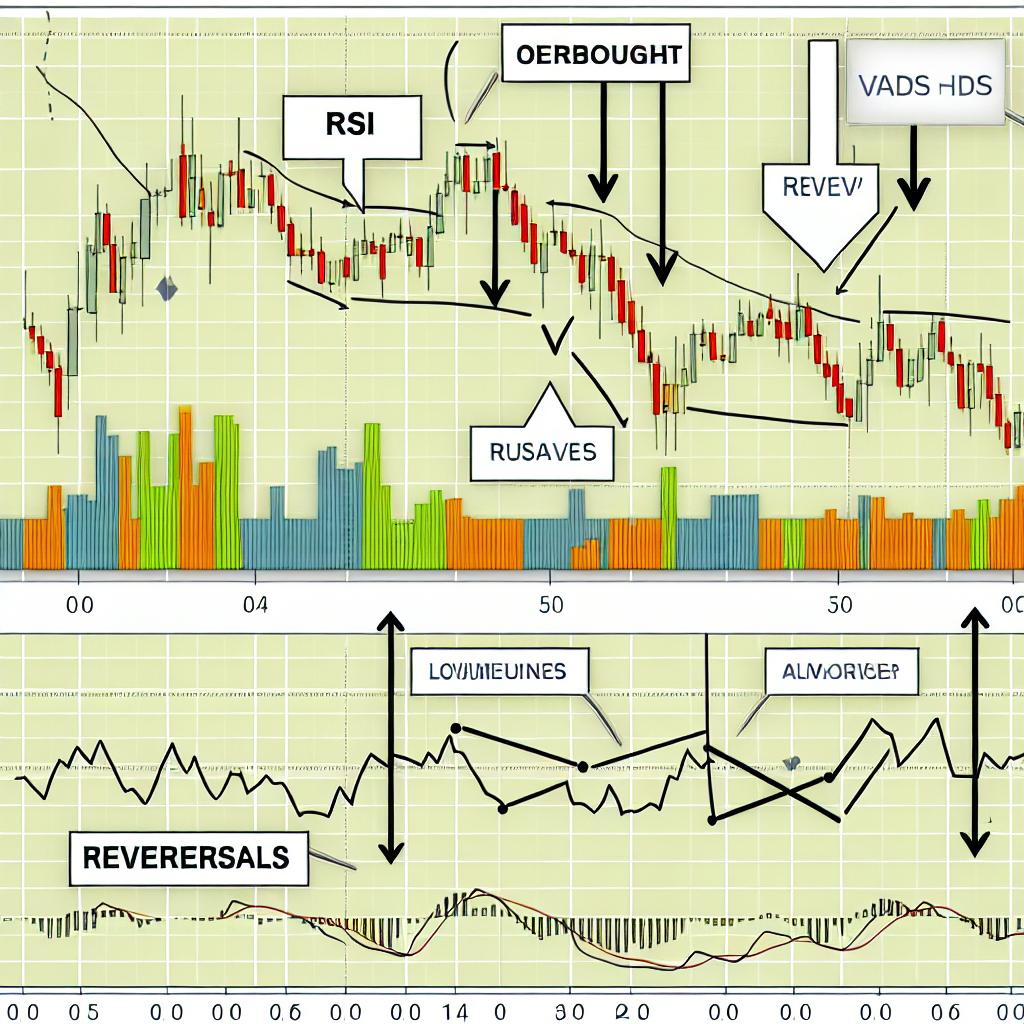
The Role of RSI in Identifying Reversals
The Relative Strength Index (RSI) is a widely recognized momentum oscillator that plays a critical role in forex trading. It does so by measuring both the velocity and magnitude of recent price changes in a currency pair, expressed on a scale of 0 to 100. The RSI is predominantly used to spot conditions where the market may be overbought or oversold, which are indicative of potential reversals.
When the RSI climbs above the 70 level, it is frequently interpreted as an indication that a currency pair is overbought, suggesting that a downward reversal could be imminent. This situation arises because the persistent buying pressure might dissipate, prompting a pullback. Conversely, when the RSI drops below 30, the indicator suggests that the market may be in an oversold state, paving the way for a potential upward reversal. Here, the sustained selling pressure may weaken, leading to a price rebound.
Using RSI for Reversal Signals
An effective strategy for utilizing the RSI involves identifying divergences between the RSI values and the actual price movements of a currency pair. Divergence is a scenario where the direction of the RSI does not align with the direction of the price. For instance, if the price continues to reach new highs while the RSI records lower highs, this bearish divergence may signal a potential impending reversal to the downside. In contrast, if the price hits new lows, yet the RSI records higher lows, a bullish reversal could be on the horizon. This signals a possible shift to rising prices, as the underlying selling momentum may be waning.
MACD as a Tool for Reversal Identification
The Moving Average Convergence Divergence (MACD) is another fundamental tool utilized by forex traders. It is a trend-following momentum indicator that showcases the relationship between two different moving averages of a currency’s price. The MACD is composed of three components: the MACD line, the signal line, and the MACD histogram.
How MACD Provides Reversal Signals
Traders often monitor the MACD for its crossover signals. A bullish reversal signal is indicated when the MACD line crosses from below to above the signal line. This crossover suggests that the upward momentum might be increasing, hinting at a shift from a downtrend to an uptrend. Conversely, when the MACD line crosses from above to below the signal line, it suggests a bearish reversal. This signal could imply that the downward momentum might gain strength, pointing towards a transition from an uptrend to a downtrend.
Divergences between the MACD and price movements can also herald potential reversals. If the price continues to rise while the MACD indicator creates lower highs, a bearish reversal may be forthcoming. Conversely, if the price declines and the MACD registers higher lows, it might indicate a forthcoming bullish reversal. Both scenarios suggest that the prevailing momentum is likely losing its strength, suggesting a potential change in the trend direction.
Combining RSI and MACD for Better Accuracy
While the RSI and MACD are valuable as standalone indicators for predicting potential market reversals, their true strength lies in their combined usage. When both indicators simultaneously point towards a reversal in the same direction, traders can have increased confidence in the validity of the signal. This complementary approach enhances the accuracy and reliability of the signals, mitigating the risk of false alarms.
For instance, consider a situation where the RSI positions itself above 70, indicating overbought conditions, and concurrently, a bearish crossover of the MACD line below the signal line is observed. In such a case, traders might foresee a higher likelihood of a downward reversal, as both indicators corroborate the potential change in trend direction. The convergence of signals from multiple indicators provides a stronger case for traders to act upon.
Conclusion
Successfully identifying market reversals in the forex market is an essential skill for formulating effective trading strategies. The Relative Strength Index (RSI) and the Moving Average Convergence Divergence (MACD) both serve as valuable tools in a trader’s arsenal for comprehending and predicting potential reversals. Although no single indicator offers foolproof predictions, the combination of different tools can significantly enhance the accuracy of reversal signals.
By integrating both the RSI and MACD into their analyses, traders can achieve a more comprehensive understanding of potential market movements. This approach allows them to make more informed and strategic decisions aimed at maximizing profitability while minimizing risks. Through continuous practice and learning, including the exploration of trading platforms and financial resources offering detailed technical analysis tools, traders can hone their skills in identifying market reversals. Ultimately, mastering the art of recognizing potential reversals makes a meaningful difference in navigating the dynamic and often unpredictable terrain of forex trading.
This article was last updated on: July 7, 2025